University of Maryland Center for Environmental Science
GIS Center
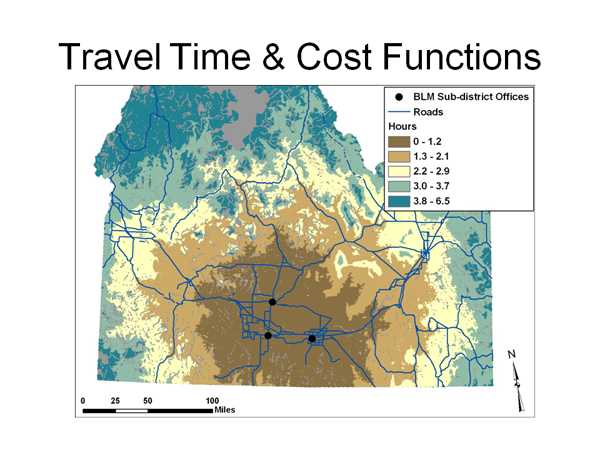
Geographic Information Systems (GIS) and spatial data analysis offer powerful tools for synthesizing data, evaluating scientific hypotheses, and making decisions on environmental management. For example, much of our work aims to prioritize restoration based on location-specific measures of potential benefits, costs, and limitations to success (click thumbnails for larger images).
We now offer GIS support on an hourly basis. Please click
here to see our services and prices.
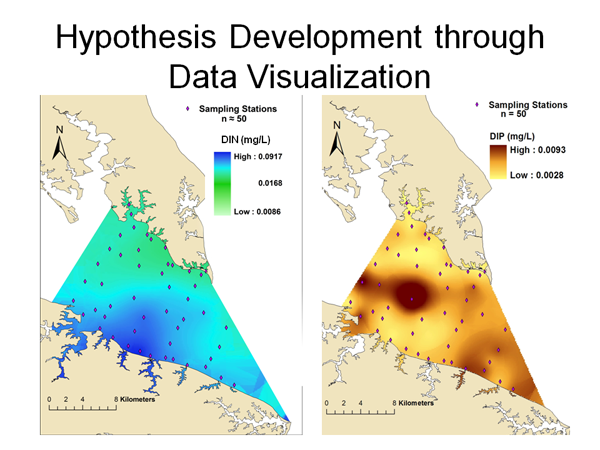
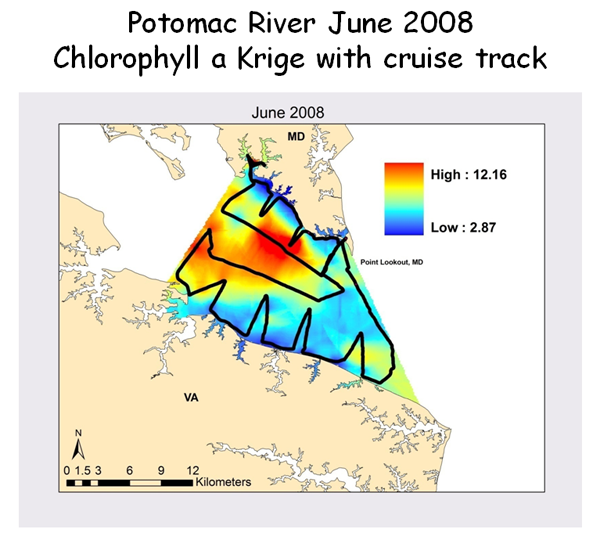
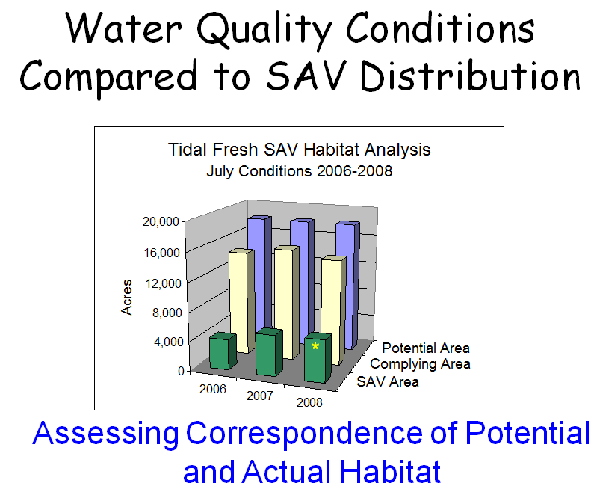
Visualizing spatial data for hypothesis development
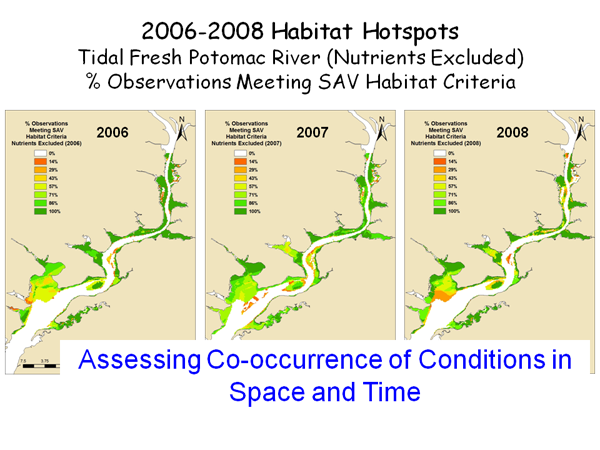
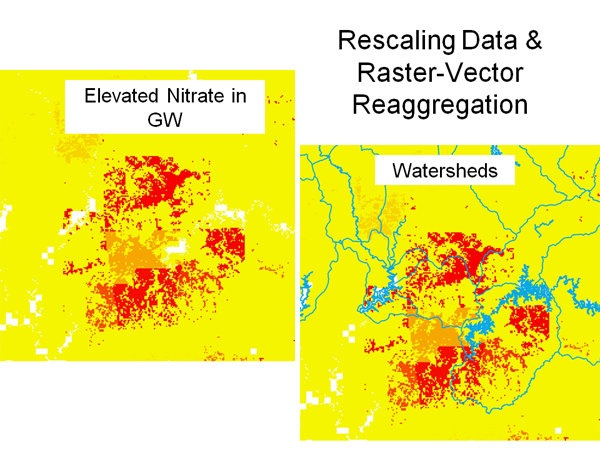
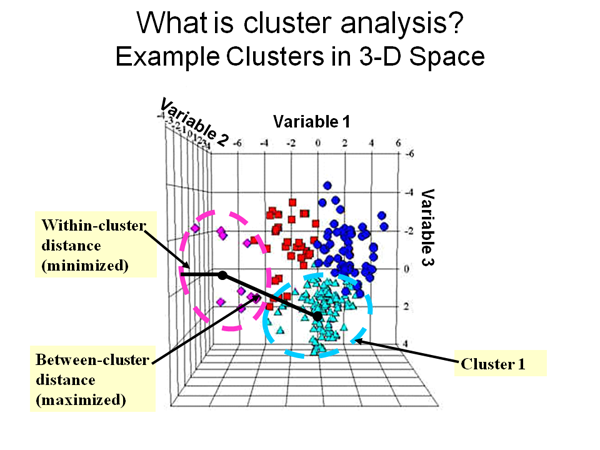
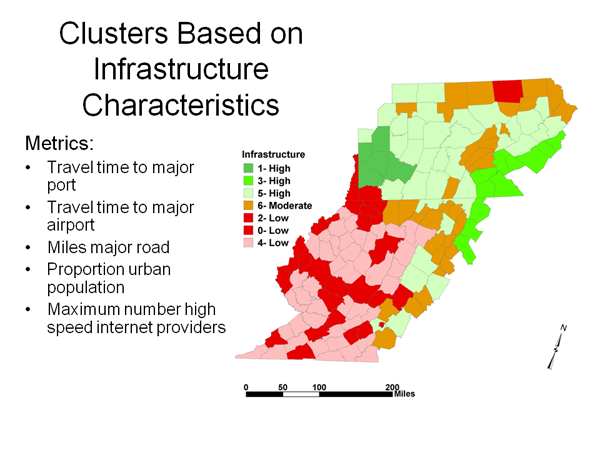
Spatial analysis - proximity and co-occurrence
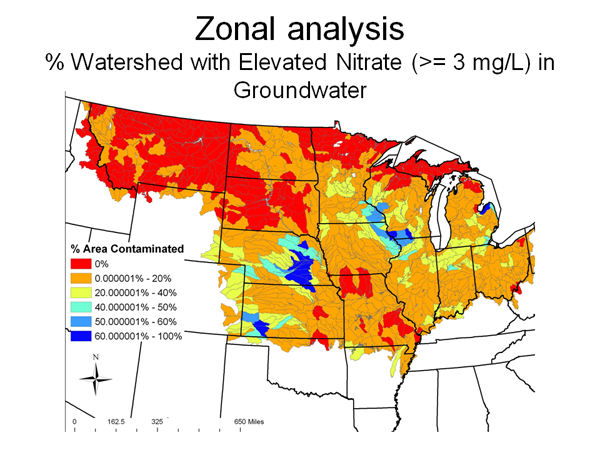
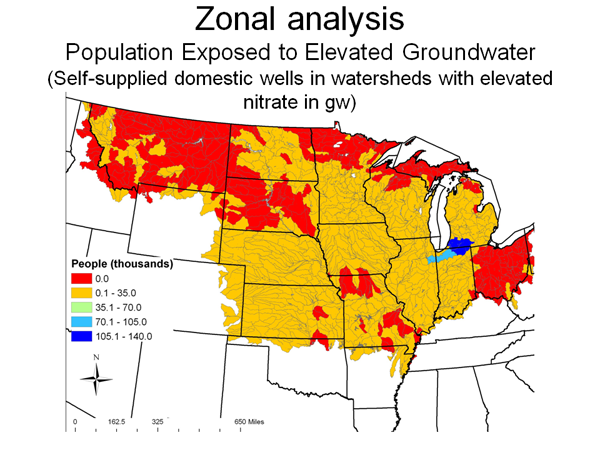
Spatial statistics and hypothesis testing
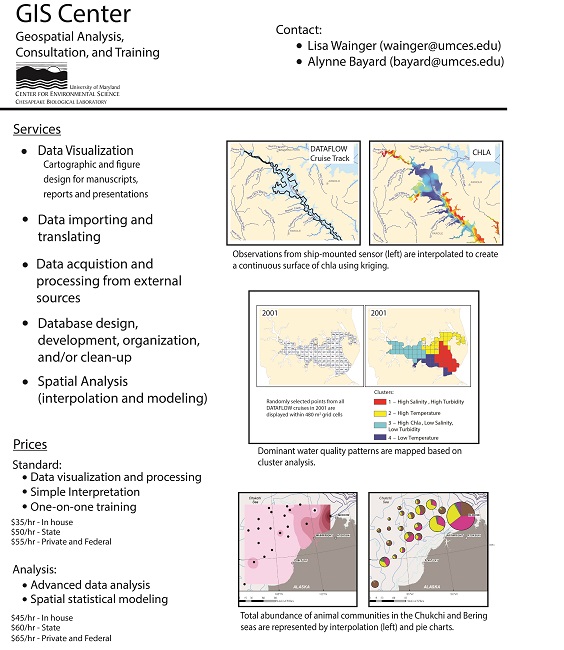
Data Visualization
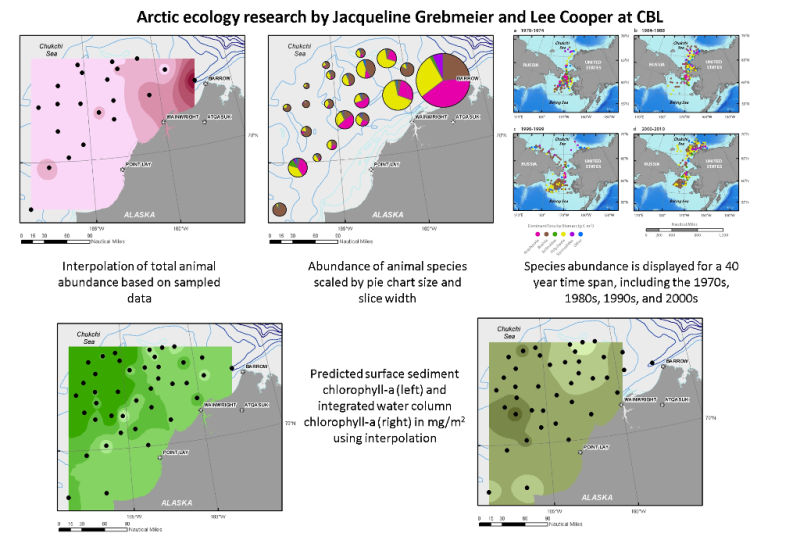
Arctic sediment samples reveal the abundance and species
richness of bottom sediments. Changes through time of benthic animal
communities are shown on the map in the upper right hand corner,
including changes in the abundance of marine worms (yellow), arctic
clams (brown), amphipods (pink), brittle stars (green), and peanut
worms (purple). Water and sediment characteristics are also mapped to
understand potential sources of variability in animal communities in
the Chukchi and Bering Sea. This work is also contributing to
understanding baseline conditions in the Chukchi Sea (northwest of
Alaska) before planned oil and natural gas extraction starts. This
research is supported by the US Bureau of Ocean Energy Management.
More information about
this Arctic scientific research